Traffic Flow Analysis
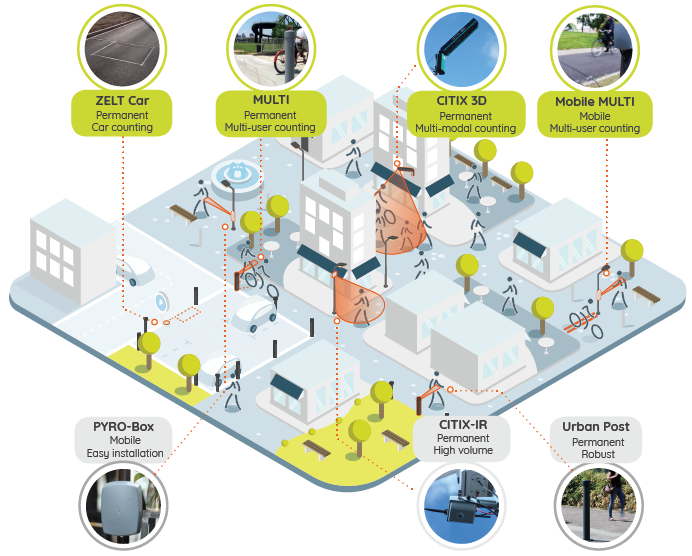
Our wide-variety of advanced solutions allow you to count people wherever you need to, including: sidewalks, main streets, pedestrian squares, pedestrianized streets, placemaking projects, event exits and entrances, store fronts and much more. From mobile to permanent, a full range of automated people counters will get you the data you need to improve your downtown management policy.
With over 18,000 counters in 54 countries, we offer 20 years of knowledge in counting technology together with our partner Eco-Counter.

Downtown management
Counting pedestrians provides downtown managers with the data they need to get the job done. Whether you are looking to assess of success of a placemaking projects, gauge the attractiveness of a downtown area, or capture the growth in event attendance, count data is a a key performance indicator for downtown projects. From simple studies to long-term assessments, our easy-to-install, mobile, high-accuracy counters are the tool you need.
Active Transportation
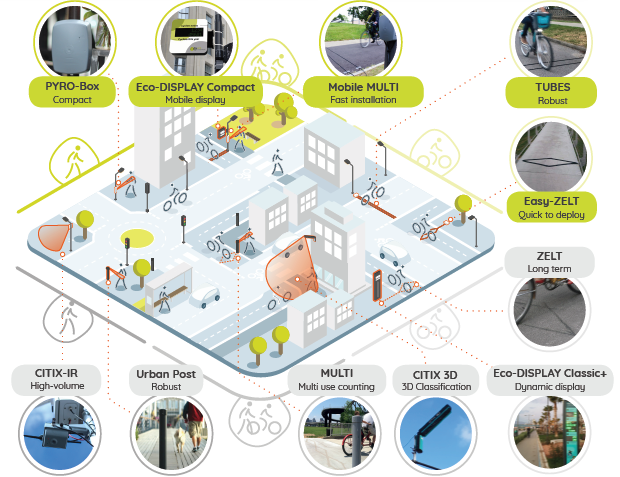
If you don’t count, it doesn’t count. Bike and pedestrian count data is an essential tool to justify investments, capture seasonal trends, plan future pedestrian and cycling infrastructure, communicate with stakeholders and the public, and much more. From short-term, multi-site traffic studies to visible count displays, we offer a range of automatic counters that are reliable, discreet, and robust. Our counters are tried and tested around the world, from London to Los Angeles, Seattle to Singapore.


Online data analysis platform
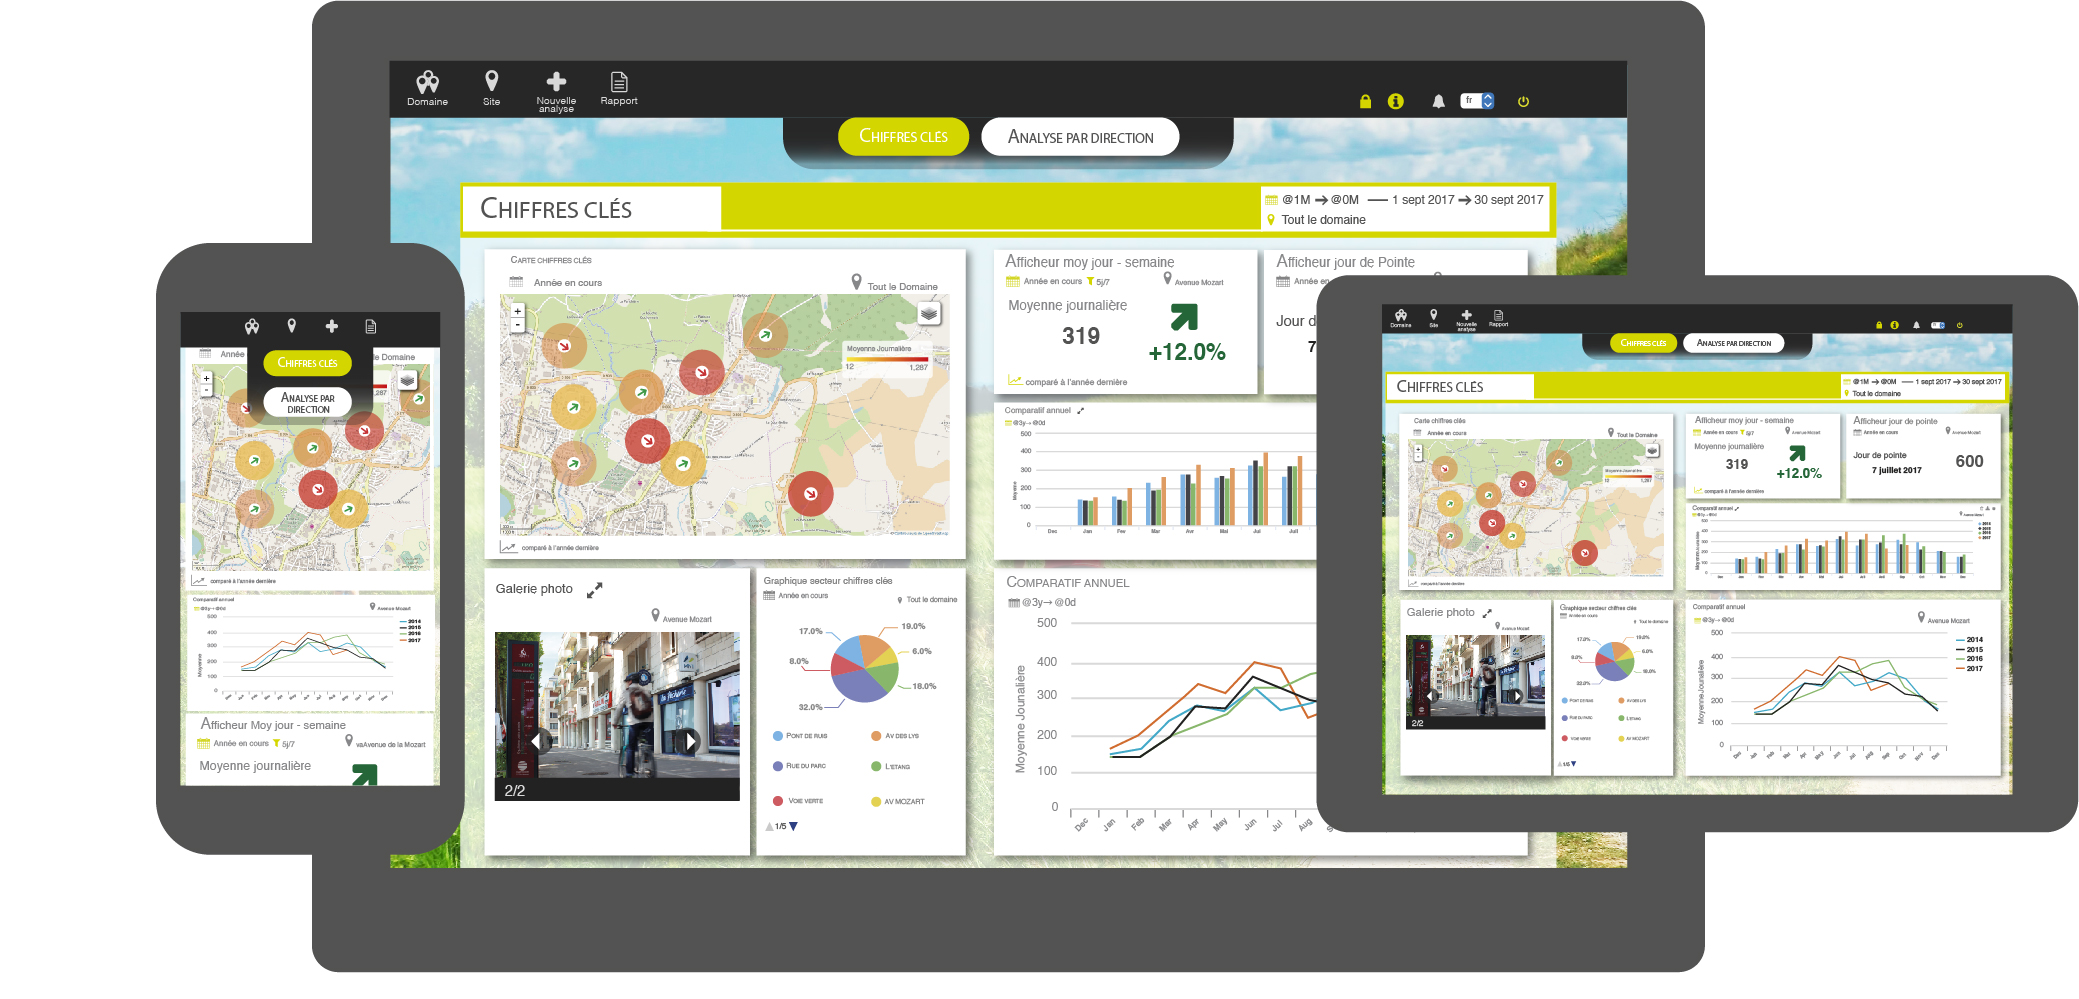
Eco-Visio 5 is our online, easy-to-use data analysis platform, to perform powerful analysis of bicycle/pedestrian counts. It presents your count data in the form of easy-to-use interactive dashboards, easily accessible from your smartphone, tablet or computer. This update allows you to save your preferred data analyses (such as hourly pedestrian profiles or peak day) and access them automatically with each login.
Dashboards consist of a variety of interactive ‘widgets’ – dynamic data visualization modules. Organize and personalize your dashboard as you wish with over a dozen widgets, including:
-
Tables with automatically-generated key figures
-
Interactive charts and graphs
-
Maps of counter location and business


